Ranging Market Detector [AstrideUnicorn]Determining if the market is in a trend or a range regime is a very complex problem. And knowing the answer can be, in some situations, the real holy grail. If the trader knows when the market is in a range regime, they can avoid overtrading and make moving average crossover strategies more profitable. A regime switch from a trend to a range can be a signal to close open positions. It can also be helpful when trading such instruments as short-term binary options. When the market is ranging directional moves are not expected, and the trader should be careful as opening a position in such conditions is, by some degree, a random outcome game. Range breakouts trading is one more example when knowing the market regime is critical.
We have created an indicator that predicts the current market regime. It smooths the price using the Kalman filter and analyzes the curve's slope. If the absolute value of the slope is low, then the market is in range mode and vice versa. To distinguish between the two regimes, the algorithm compares the absolute value of the slope with its long-term average.
HOW TO USE
The indicator shows the difference between the absolute slope value and its long-term average as a histogram. When a bar of the histogram is higher than the threshold level presented by the red line, the market is in a trending regime. In this regime, the background of the indicator is blue. When the market is in a range regime, the indicator background turns red.
The threshold level helps to control the lag. The greater it is, the more lagging the indicator will be. By default, this value is set to a negative value. It means that the indicator switches from range to trend a little bit earlier than the slope gets higher than the average slope. You can use the value of zero or low negative values to find the optimal tradeoff between the strength of the signals and their lag.
SETTINGS
The indicator has one input parameter called Threshold. It sets the threshold level described above. Its value should be close to zero. The less the value is, the less is the indicator's lag, but at the same time, the less confirmed the regime-switching signals are.
The use cases can be very different. And as the code is open, you can also use the indicator as a building block for your custom trading strategies.
Let us know your thoughts and suggestions!
Cari dalam skrip untuk "binary option"
Multi-TimeFrame SignalsI trade binary options on reversals. I use this as a confluence to prove that my analysis is correct. I use this on smaller time frames given the type of trading I do.
I do not use this as an entry trigger, so you should not blindly enter trades based on this solely . You were warned
This indicator (on default settings) will let you know when the 1 minute, 3 minute, and 5 minute timeframes RSI & Stochastics are all in an overbought or oversold state. It shows this by changing the background color on your chart to red (overbought) or green (oversold).
All of these settings are changeable. #winning
I left this as open-source as I figured out how to code this by using other open-source scripts as reference. I am a programmer that uses other languages.
I only published this script as a request from a close friend.
YouKnowTheVibesThis is mainly used for trading binary options but can be used for regular forex trading as well. If price is above BOTH EMAs and PSAR then you're looking for BUY opportunities. If price is below then you're looking for sell opportunities. Wait for price to break the most recent fractal high/low and retest; wait for a confirmation candle then enter a call/put and the expiry time is THREE candles.
HFX Kung Fu Pips Candlestick Identifier by Trader ZThis indicator identifies the following candle stick patterns:
Bullish and Bearish Engulfing
Hammer/Hanging Man, Shooting Star
Tweezer Tops and Bottoms
Doji Star
Doji Gravestone
Made for trading Forex Binary Options but can be used in any market. When the candlestick pattern emerges the script will label the pattern. A helpful visual tool for your analysis.
Enjoy!!!!
Evan Cabral's Quarter Theory by MrTuanDoanThis indicator is based on Evan Cabral's Market Timing Strategy.
In Binary Option or High Frequency Forex (HFX), it's very common to see the market make reversals at hours and half hours.
This indicator just simply draw vertical lines at each quarter of the hour.
You should change the color and opacity to fit your chart style.
With this indicator, you're going to know when to positions yourself with more accuracy on trade setups.
Note
It works best if you take your reversal trade at the top of the hour using your other (overbought/oversold) confirmation using RSI, Stoch RSI, DMI, etc.
It works better if you take your trade at resistance/support zones
You should pay attention to the direction the market is going before the hour (or half hour) and looking at how the direction changes going into the hour or after it.
Please backtest before taking real trades
Trend Quality cross [LM]Hi Guys,
I would like to introduce you Trend quality cross indicator. The idea orginallybcomes from @kruskakli and his indicator "Trend Quality" so shout-out to him
I have modified the indicator to display just binary option buy/sell and display diff percentage from previous cross. Also there is a difference that I have double smoothed tq indicator results to give less false signals.
and also added for the same reason like in my other indicator vpci ma cross base line and conversion line from ichimoku.
Any suggestions are welcomed
Williams Fractals with Alerts by MrTuanDoanCustom William Fractals for alerts and educational purpose.
Added custom alerts for Williams Fractals.
Also added filter to show less fractals on chart.
The simple idea how I use fractals in Binary Option is to determine temporary resistance and support.
Simple strategy:
- Mark Resistance/Support on higher time frame (e.g. 5M)
- Set an alert for new fractal
- Whenever a new fractal that appears close to your marked Resistance/Support, go to lower time frame (e.g. 1M)
- Wait for rejection at the level that lower than new down fractal (or higher than new up fractal).
- Enter with the same expiry of lower time frame.
Good luck and happy trading. :-)
Viejito MMR2 UpperThis set will help you get better opportunities to trade binary options. When price is close to any line, use the fibonacci to get confirmation and you can take 5 minutes trades. Always analyze in 5 min timeframe
Stochastic binary option styleUsing Time Frames For Trend – You can also use different time frames to determine trends with stochastic. To do this you will need to use two different time frame charts, I like to use the weekly/daily or daily/hourly combination depending on the asset. Weekly/daily works well with stocks and indices while I prefer the shorter time frame for currency and commodities. This is how it works; stochastic on the longer term chart sets trend, stochastic on the shorter term chart gives the signal. If, on the weekly chart, stochastic is pointing up then you would trade bullish signals on the daily charts. Or if using the daily/hourly combo the stochastic on the daily would set trend while signals would come from the hourly chart.
Green color bar and background means k is > d, the crowd is bullish (trend is bullish, a bullish crossover is happened), red is the contrary (bears are the leaders)
Credit to Michael Hodges
TradingView's Technical AnalysisAll indicators used on the Technical Analysis Summary from TradingView, composed with oscillators and moving averages. Sell and strong sell will represent more indicators showing sell signals. Buy and strong buy will represent more indicators showing buy signals. A white bar will show neutral signal (don't trade). This can be good for binary options or scalping on small time frames, but also very good on higher times for forex. The signal will appear on the candle before, so wait for the new candle to appear to see what direction the signal will indicate.
Bollinger Bands SqueezeEnglish:
Simple histogram, showing Squeeze of Bollinger Bands.
Usage is simple - when price is in Squeeze, no entries in any direction. For using with Bollinger Bands indicator, including binary options.
Russian
Простой индикатор, наглядной отображающий стадию Сжатия лент Боллинджера.
Простой в использовании - когда цена в Сжатии - не входим в сделку. Особенно эффективен при связке с индикатором лент Боллинджера и входе в сделку при раскрытии лент. Также применим для бинарных опционов
Example/Пример
Noro's BinaryHacker v1.0The indicator isn't redrawn (the last candle can be redrawn because it still changes).
NOT indicator shows a bottom of the market or top of the market!!! The indicator shows what there will be a color of the following candle.
The index up under the current candle means that the following candle will be growing (there will be a green candle). And vice versa. The index down under the current candle means that the following candle will be falling (there will be a red candle). The indicator shows only on one following candle. It is not the trend indicator!
Well for Forex and binary options.
Amplitude IndicatorHello Traders,
Amplitude is the measurement of the difference between the variable's extreme values.
This indicator is based on the Balance of Power (close-open)/(high-low).
Instead of taking the value of a single candlestick, exponential moving averages are used in the formula.
On it's lowest settings (1,2) it's exactly the same as the Balance of power, by adjusting the smoothing you can seen the highs and lows in momentum of the chosen period. (highly adjustable RSI)
By adding a simple moving average (Signal Line) it turns into a cross-over type, like MACD with a histogram.
This indicator is doesn't have a default or 'best' setting, instead I use the Fibonacci numbers as input. (1,2,3,5,8,13,21,34,55,89,144).
Depending on its settings this indicator is well suited for binary options, trend and reversal trading.
Cheers, Indicat...
Candle pattern doji-harami just something I wipped together. Unused code still in script and left there for you to experiment with. simple classic doji candle pattern recognition code. Binary option use recommended. red arrow suggest down trade and green for up trade. if market direction fails then a black arrow pops up on next candle. this is to help quickly judge the accuracy while experimenting with input numbers.
Fast/Slow RSIYo Traders,
This indicator is inspired by the RSI-2 strategy in combination with a somewhat smoothed RSI-14.
It has a zero-line, allowing it to use columns or an area as a histogram.
A nice tool to find that perfect entry/exit point, also very useful for Binary Options.
Cheers, Indicat
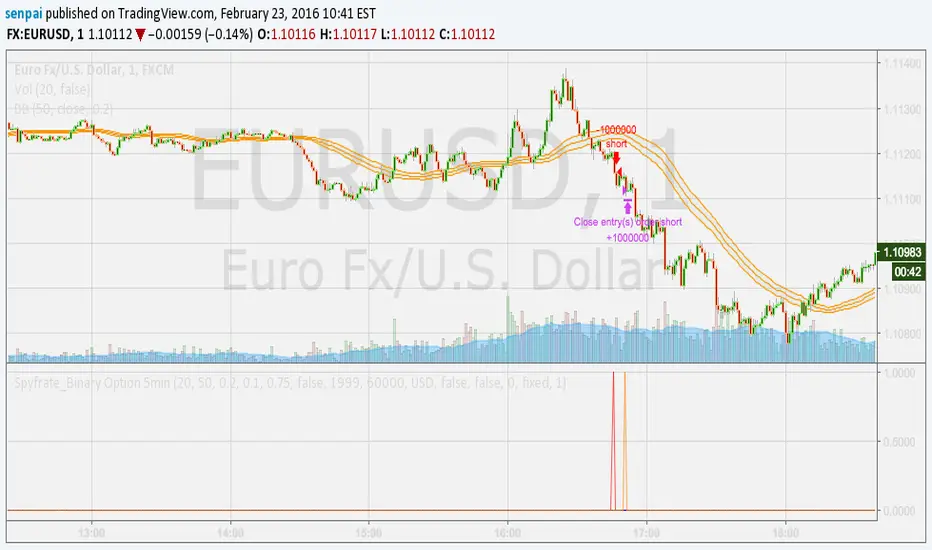
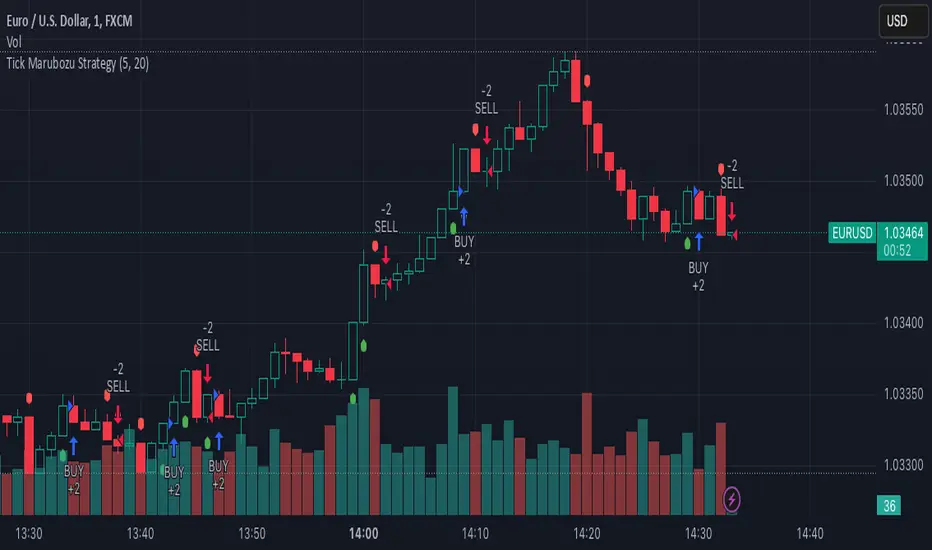
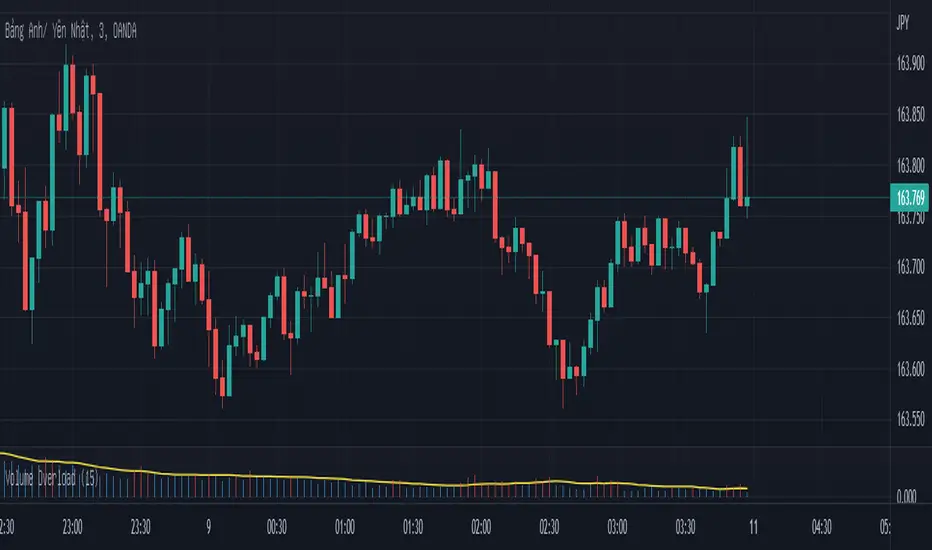
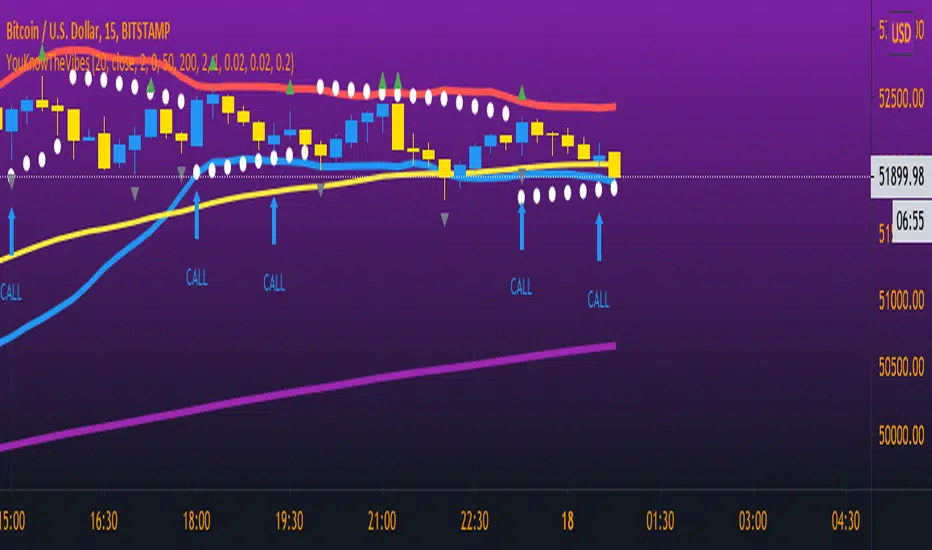
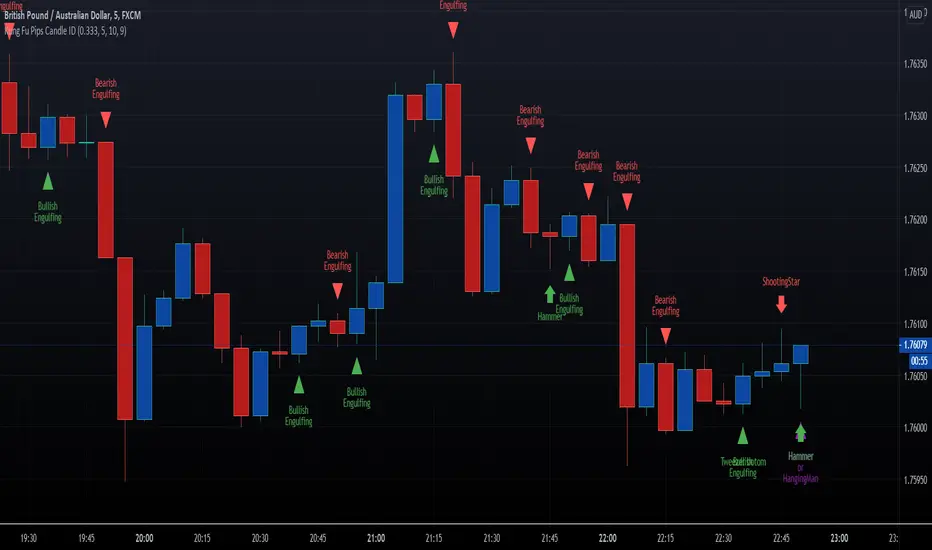
Simple_Buy_Sell_Signal PipizerThis is a simple buy and sell pattern based on my customized candlestick pattern and trend following. This indicator can also be used for binary option trading except the selling signal candle is not touching the lower band and the buying candle is not touching the upper band.
EA_Binary Option Spfrat StrategyThis somehow my Phase 1 of Clean EA on Binary Option using Spyfrat Idea and with Help Trading View Community.
Timeframe = 1 minute
Strategy: (Momentum)
1) BB 50 0.2
2) RSI (30)
3) Time Squeeze - to somehow disregard consolditation
My EA Strategy for 3 minute BOI made an EA for my long term project on Binary Option trading.
TimeFram = 1 minute
Signals are:
Green Spike = Buy (for 3 minutes expiration)
Red Spike = Sell (for 3 minutes expiration)
Strategy:
VMWA (50&200) = Trend Indicators
RSI (30) = pull back entry signal on a strong trend
BackTest = 80% Winning Rate
Improvements Needed:
>> Better Entry Star Signals
>> How to be automatically connected to a certain broker for HFT
Stoch_VX4 Expiry / UpdateStoch_VX3 Update
Stoch crossover +
Fast stoch / Tops & bottoms
BO background expiry


